Retail Sales Prediction
Our goal is to predict sales for retail stores based on historical data provided, with the help of various factors like store type, location, promotional activities, and trends (e.g., holidays, seasons). This will enable the management to make data-driven decisions on financial planning, inventory, marketing, and operations.
Sando Varghese
Introduction
To be successful in today’s competent business world, the retail store needs to forecast some attributes, so that they can maximize the sales and profit like inventory required, running campaigns and ads, financial planning, etc. Here, I am going to walk you through the process of setting up a forecasting model using machine learning to predict sales. We’ll explore the data, do feature engineering, build a model, and evaluate the same using Python.
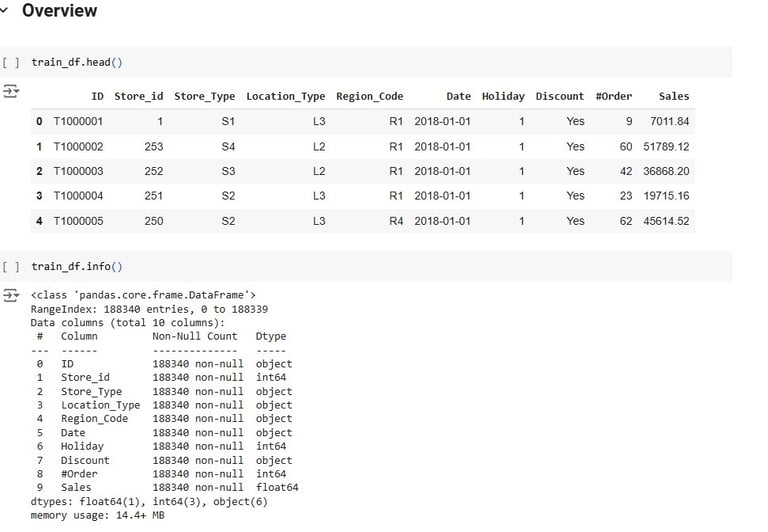
Data Overview
Data set provided consist of following features:
Store ID : Unique ID for each store.
Store Type : Classification based on the type of store.
Location Type : Classification based on the type of location like cities, metro, etc.
Region Code : Geographical region code for the store.
Date : Date of sales.
Holiday : Indicator of holiday or non-holiday.
Discount : Whether a discount was offered on a given day or whether promotional activities were carried out on the given day.
#Orders : Number of orders received by the store.
Sales : Total sales amount for each day (Target).
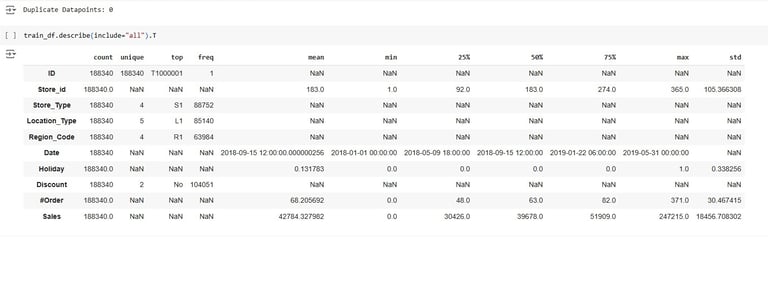
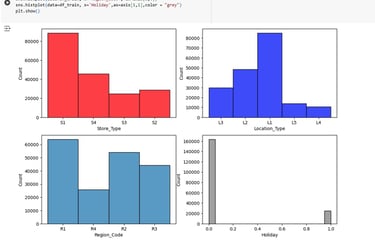
Insight from Data Overview
There are 188340 number of order data.
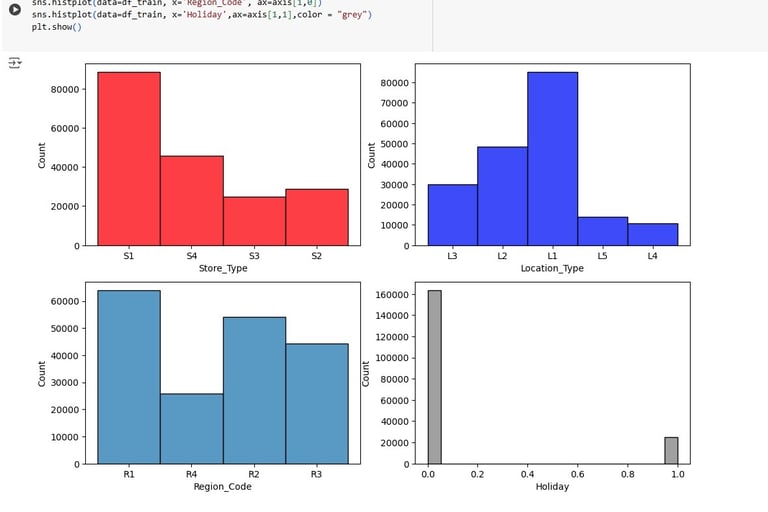
There are 4 Store types, 5 Locations, 4 regions in the Data.
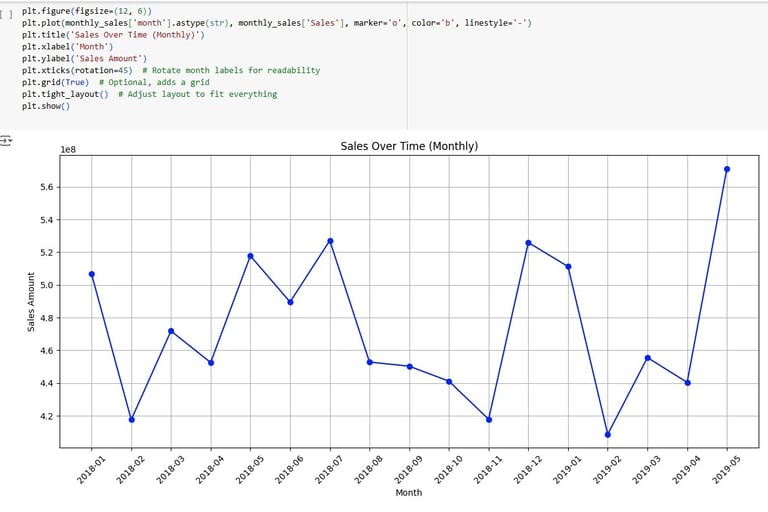
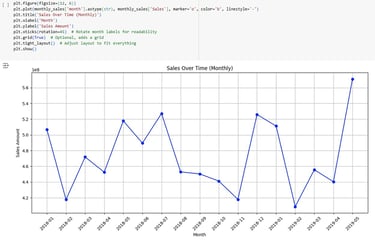
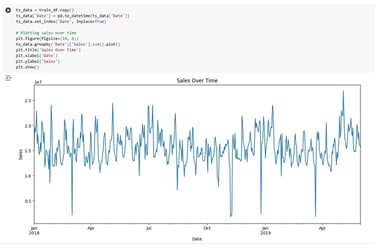
The data starts from 01-01-2018 to 31-5-2019.
Most orders are from S1, L1, R1.
The highest sales value is 247215.
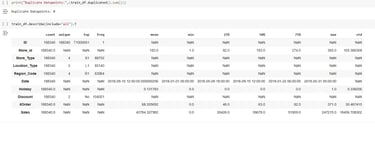
No duplicate values, hence removal of duplicate value step can be avoided.
No missing values in Data, hence missing value treatment step can be avoided.
1. Exploratory Data Analysis
2. Hypothesis Testing
3. Machine Learning Model
Primary step is to understand the characteristics of data, and to identify features that influence sales
1.1. Univariate Analysis
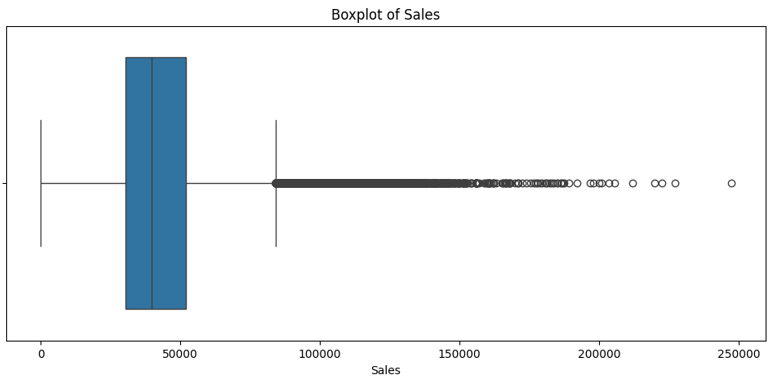
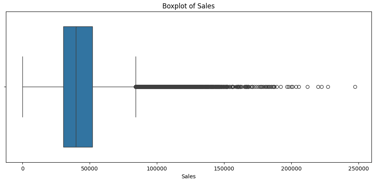
We explored distributions for each feature, particularly Sales and #Orders, using histograms and box plots to check for outliers. Here’s what we found:
i. Sales showed some high outliers, indicating that certain days had very high sales.
ii. The distribution of #Orders suggested a positive correlation with Sales, which makes sense intuitively.
1.2. Bivariate Analysis
Using correlation matrices, we examined relationships between features:
i. Discount and Sales: Sales were significantly higher on discount days.
ii. Holiday and Sales: Surprisingly, sales tended to be lower on holidays.
1.3. Feature Engineering
i. New feature the derived from date column, which are day, month and year.
Note. Outliers are not removed because sales value outliers can be true and real, as the trend on non-holiday promotional days is high.
4. Deployment
To check the statistical impact of promotional activities, holidays, store type, and region on sales, we have done hypothesis testing and found the following results:
2.1. T- Test result for discounts on sales:
· High T-statistic suggests mean-sales on days when promotional activities are done are high.
· P-value is below 0.05
2.2. T- Test result for holidays on sales:
· Low T-statistic suggests mean-sales on holidays are less.
· P-value is below 0.05
2.3. ANOVA test result for sales by store type:
· High F-statistic value suggests sales in some stores are much higher compared to others.
· P-value is below 0.05
2.4. ANOVA test result for sales by region:
· High F-statistic value suggests sales in some regions are much higher compared to others.
· P-value is below 0.05

From all of the above insights, we proceed to build a sales predicting model using ML
3.1. Data Preprocessing
3.1.1. Extracting year, month, and day from the date to capture the trends.
3.1.2. Encoding and scaling - one-hot encoding is used for categorical variables (like store type) and scaled numerical features.
3.2. Model Selection
We tried several models to predict the sales, like Linear regression, Random Forest, etc.
All the models performed well
XGBoost Regressor and RF model out performed.
Further model tune was performed and XGBoost model was selected.
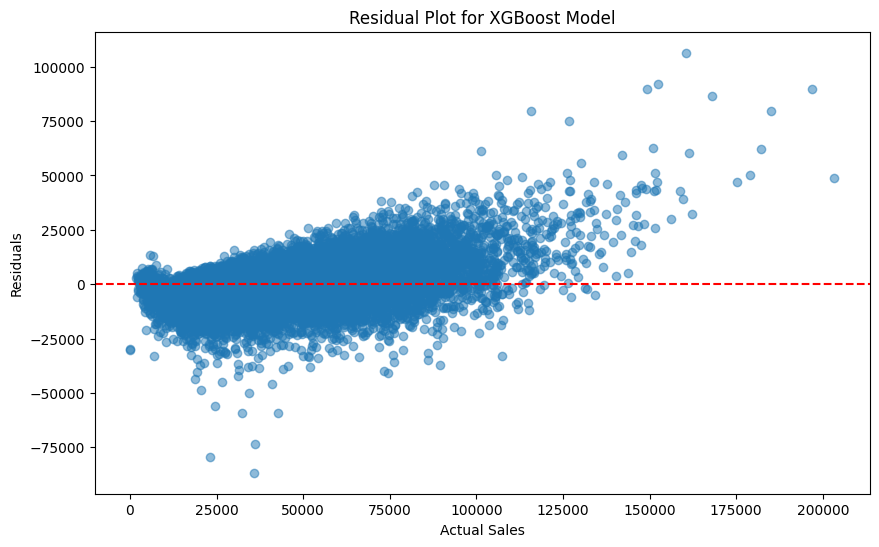
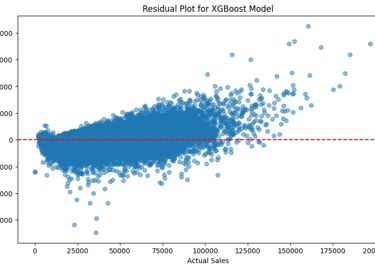
3.3. Model Evaluation
Each model was evaluated using the R Score, Mean Absolute Error (MAE), Mean Squared Error (MSE), and Root Mean Squared Error (RMSE) on the test set. Here’s how the models performed:
Linear Regression: R2=0.54, MAE = 8681, RMSE = 12366
Random Forest: R2=0.71, MAE = 6730, RMSE = 9870
XGBoost: R2=0.71, MAE = 6922, RMSE = 9936
Random Forest and XGBoost gave the best R2 results, the smallest prediction error, capturing the nuances of the data better than the other models.
3.4. Model Tuning
Model tuning is performed on both RF Model and XGBoost model. After the tuning models are evaluated, their results are:
Random Forest: R2=0.77, MAE = 6054, RMSE = 8650
XGBoost: R2=0.83, MAE = 5129, RMSE = 7420
Hence, we are opting XGBoost model for prediction.
5. Recommendations
4.1. Saving the Model
To deploy the model for prediction, we have to save the model. Here, we are using pickle for that.
4.2. Web App
After saving the model, we can create a streamlit app to allow users to input the feature, so that the model can predict the sales for a given future date.
Since, data proves that discounts boost sales, as well as sales on holidays are on the lower side, and some regions and store types contribute more to sales.
Promotional activities – discounts and offers can be run on low sales non–holiday days
Holiday days – management can more concentrate on other activities like maintenance work, upgradations, etc on these days
Inventory - more inventory can be diverted to stores and region where there are more sales. Interstock transfer of nearing to-expiry goods can be done to stores with high sales.
6. Conclusion
This project demonstrates the power of machine learning in predicting retail sales. I have covered everything from EDA and hypothesis testing to model selection, evaluation, and deployment. The insights and recommendations provided can help retailers optimize inventory, staff efficiently, and plan targeted marketing campaigns, all of which contribute to better business outcomes.
Through this project, we saw how combining data science and domain knowledge can create a robust, data-driven sales forecasting solution, ready for practical implementation in the retail industry.
Links:
Web APP:
https://sandovarghese.streamlit.app/
Github:
https://github.com/sandovarghese/DSML_Oct_2024
Tableau:
https://public.tableau.com/app/profile/sando.varghese/viz/RetailStoreDashboard_17314161597860/Dashboard1?publish=yes
Blog:
https://sandovarghese.com/retail-sales-prediction
Video: